Gantt Chart: Project & Product Management Tool
A Gantt chart is a project & product management tool that shows the progress of a project over time against a schedule. This tool is widely used to IT companies and manufacturing industry.
PROJECT MANAGEMENT, BUSINESS ANALYSIS
Let's try to understand what is GANTT CHART and how it is helping projects, managers and team members to track the project requirements in easy way.
history of gantt chart
The Gantt Chart is a Project Management visual tool used for planning and tracking the project's progress and showing which activities are planned over period of time along with resources involved.
Henry Gantt, an American mechanical engineer and management consultant, invented the Gantt chart around 1910. The Gantt chart is a horizontal bar chart that helps project managers plan, coordinate, and track tasks. It was designed and popularized by Henry Gantt around the years 1910–1915.
In the evolving world of IT project or product management, Gantt Chart has stood out for its effectiveness in visualizing timelines and tracking progress. Of course there have been changes made with respect to concept & visualization but it’s all for the sake of tracking projects with ease. This tool can help managing a complex project with multiple stakeholders or a simple projects with tight deadline.
components of gantt chart
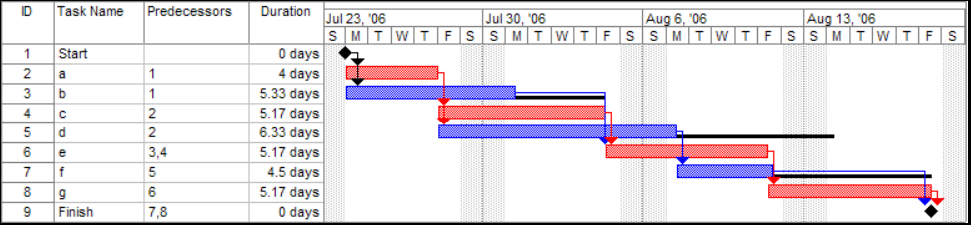
-It consists of a list of tasks and bars depicting each task’s progress. Below image is a sample Gantt Chart. Let's learn about it's components.
-ID: Each task has unique ID.
-Task Name: Name of the activity or task to be done to complete the project successfully.
-Predecessor: Shows that which task needs to be completed before starting current task.
-Duration: Tells us how much time required to complete a task.
-Calendar: The horizontal bars of different lengths represent the project timeline, which can include task sequences, duration, and the start and end dates for each task.
advantages
- It is to represent the project schedules and activities/tasks.
- Easy to represent tasks, milestones and project activities.
- It helps to view the plans by day, week, month, quarter and year
- Easy tracking of resources and time.
- Easy to group all sub tasks under a main task
- We can view the team members and their responsible tasks
- View project status and helps is easy reporting
- Can manage multiple projects
- We can view completed % of tasks
- We can easily coordinate with the teams
disadvantages
- Require more efforts for creating and managing the chart
- Updating a chart is very time consuming
- All tasks are not visible in a single view
- Need to scroll to view all actions
- Stacks represents only the time and not the hours of the work
- Not easy to re align the tasks from on section to another
- Not easy to calculate the aggregates
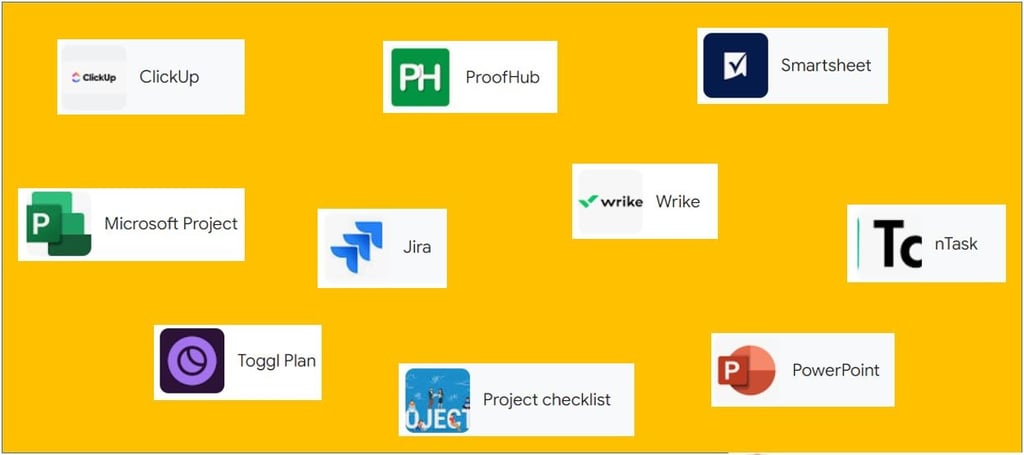
Tools to create gantt chart
There are plenty of tools available in the market few of them are list below:


Address
# 4-138/1, 2nd Floor, Above CARE Medical Store, Opp. HDFC Bank, Backside Chanda Nagar Bus Stop, Lingampally, Hyderabad, TG - 500050